Visualizing an abstract data set
Poster design for the Eindhoven Municipality
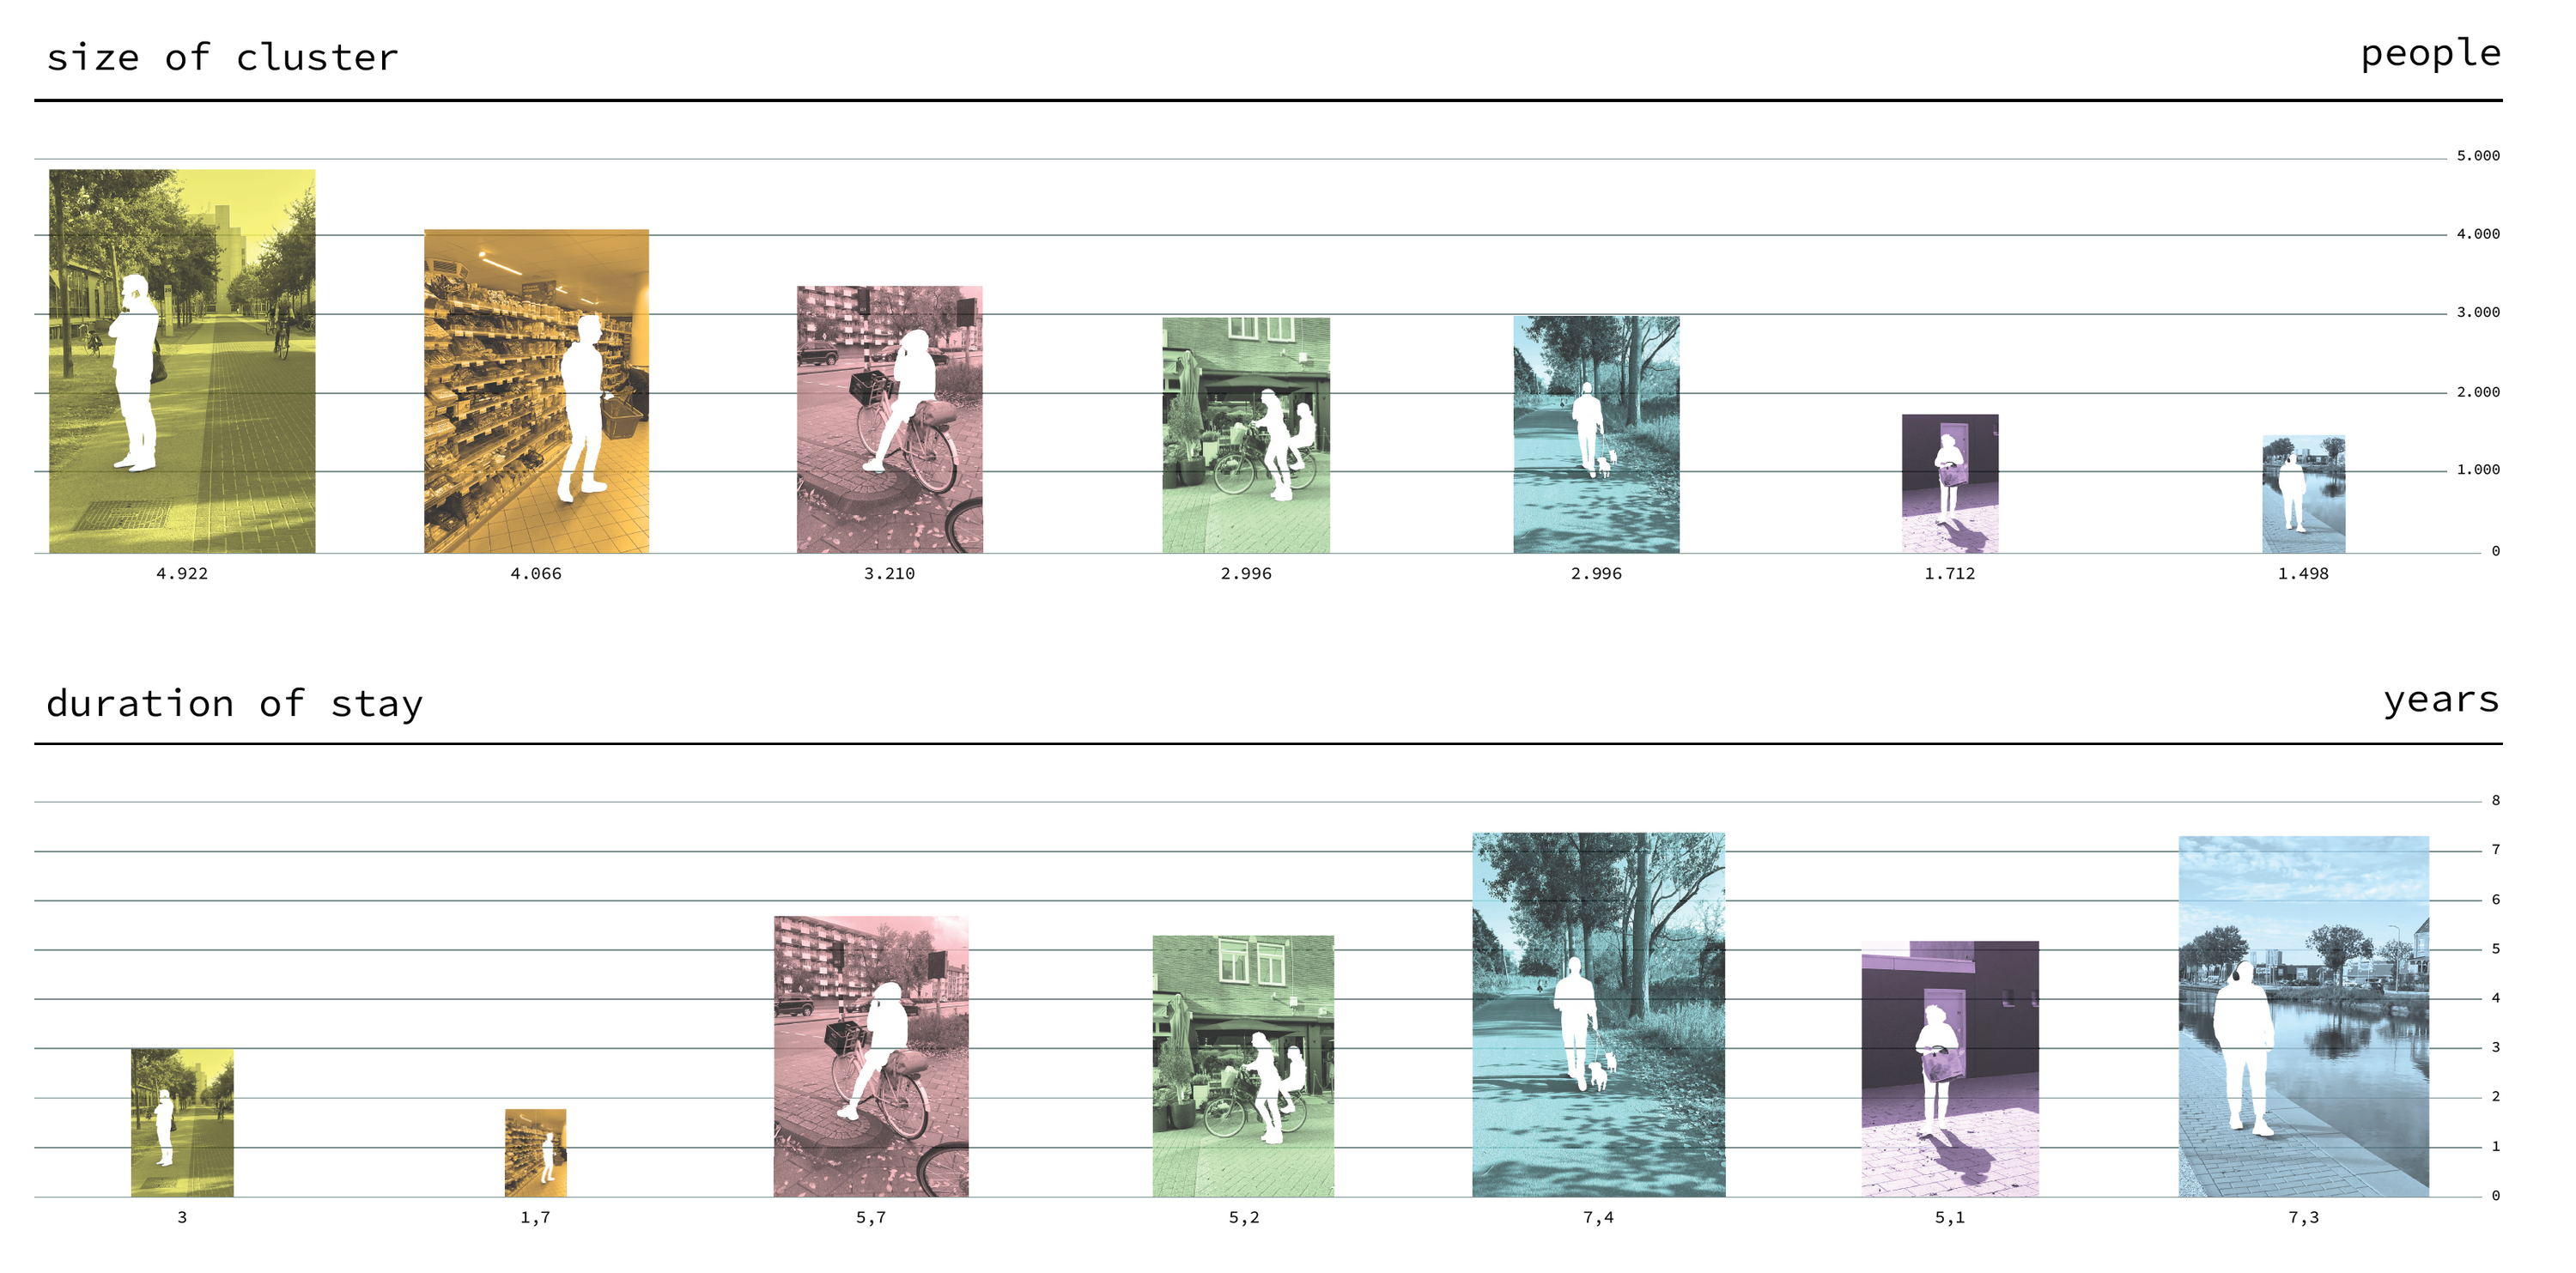
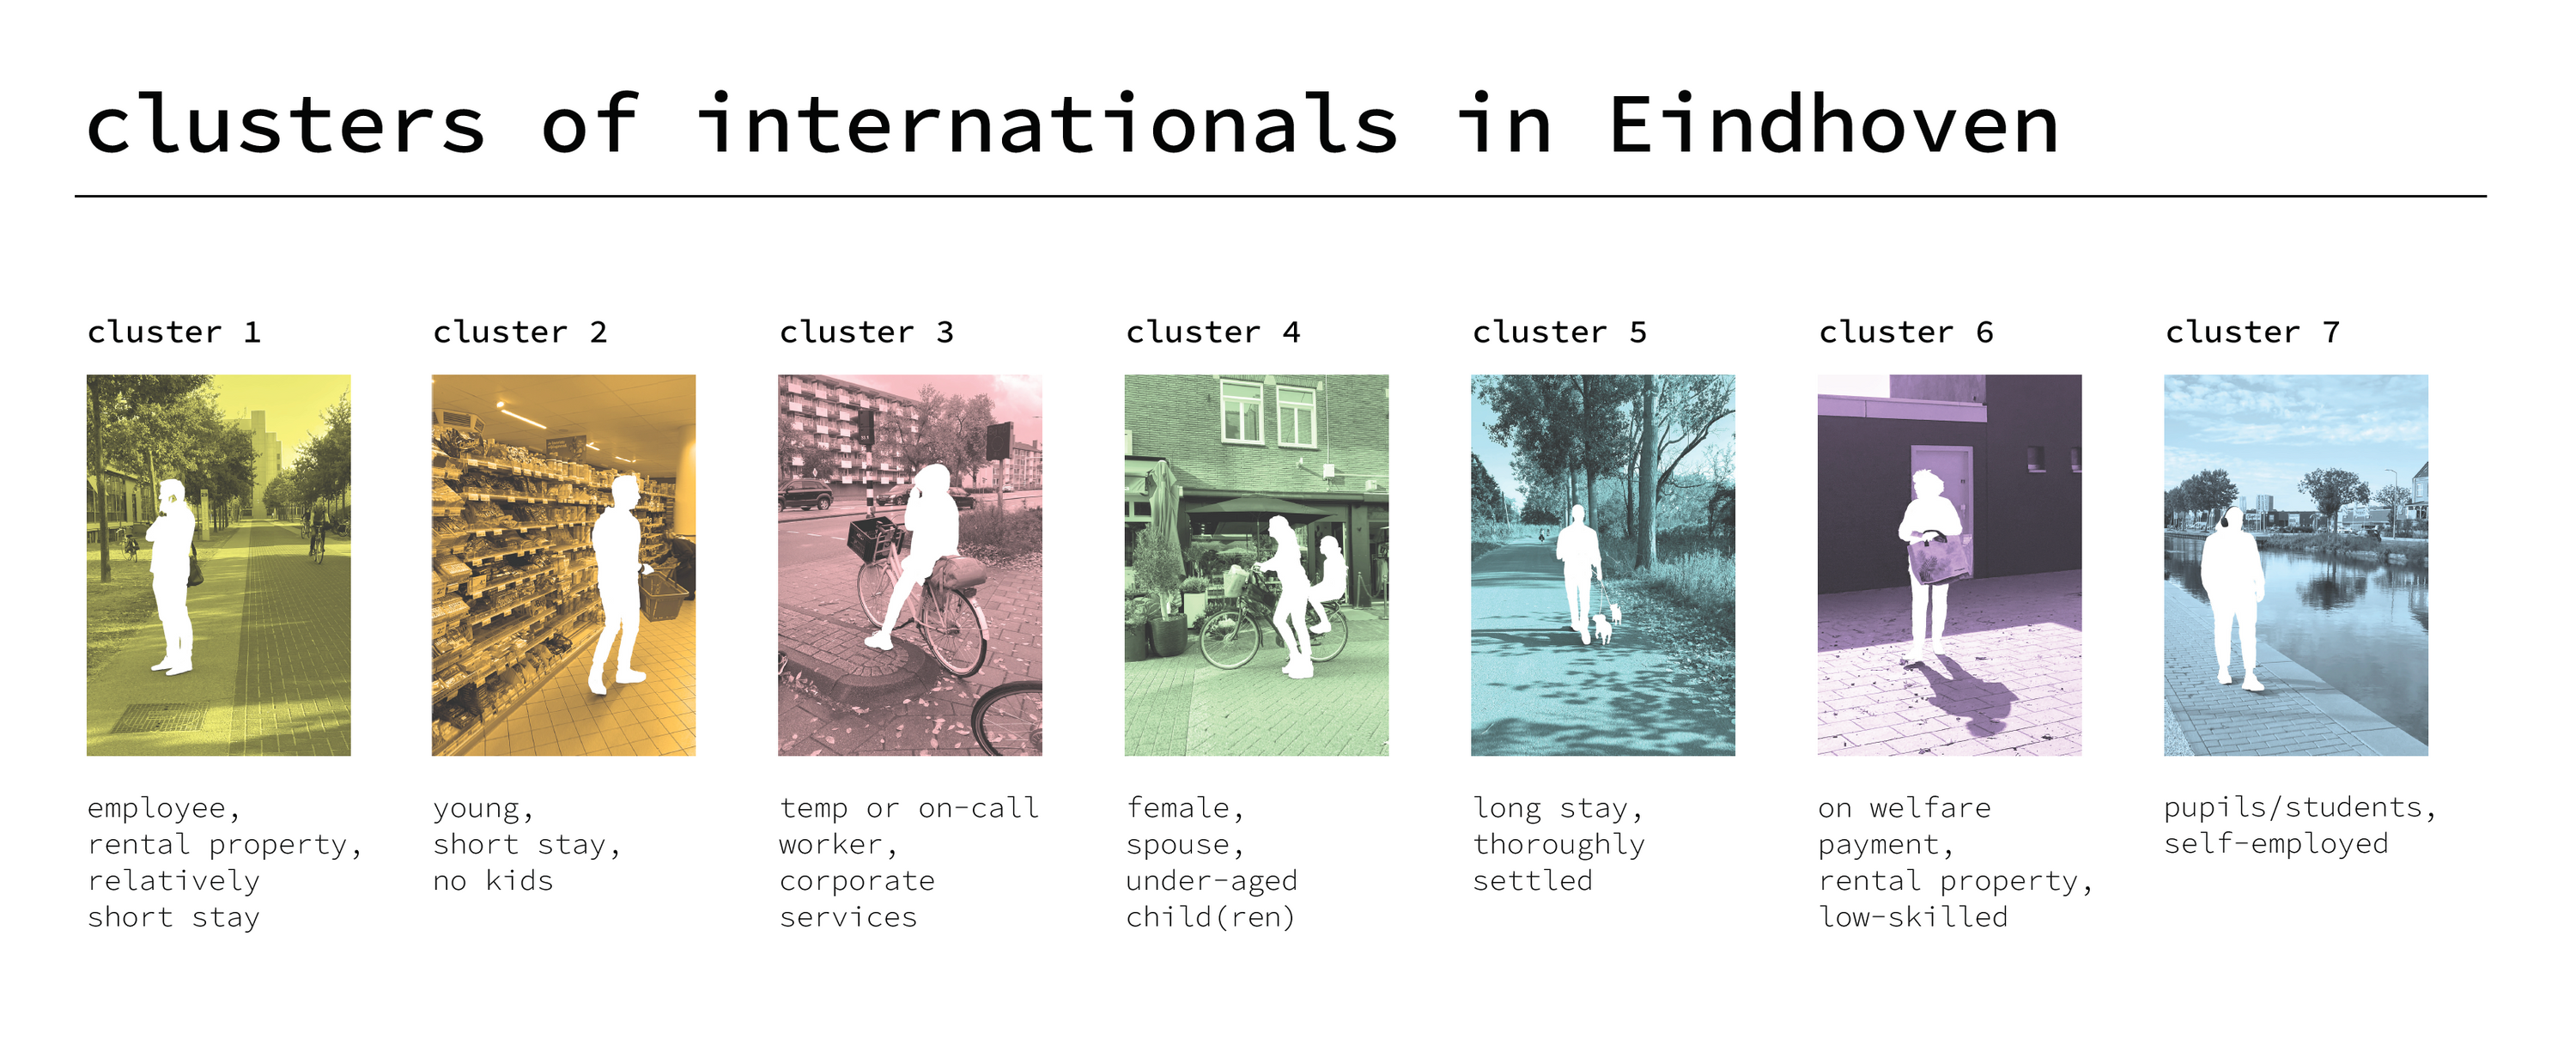 Legend on poster, clusters as defined by municipality,
As commissioned by the Eindhoven Municipality and the Van Abbe Museum for Dutch Design Week 2020. I was tasked with visualizing a set of collected data into a poster to be exhibited at Dutch Design Week.
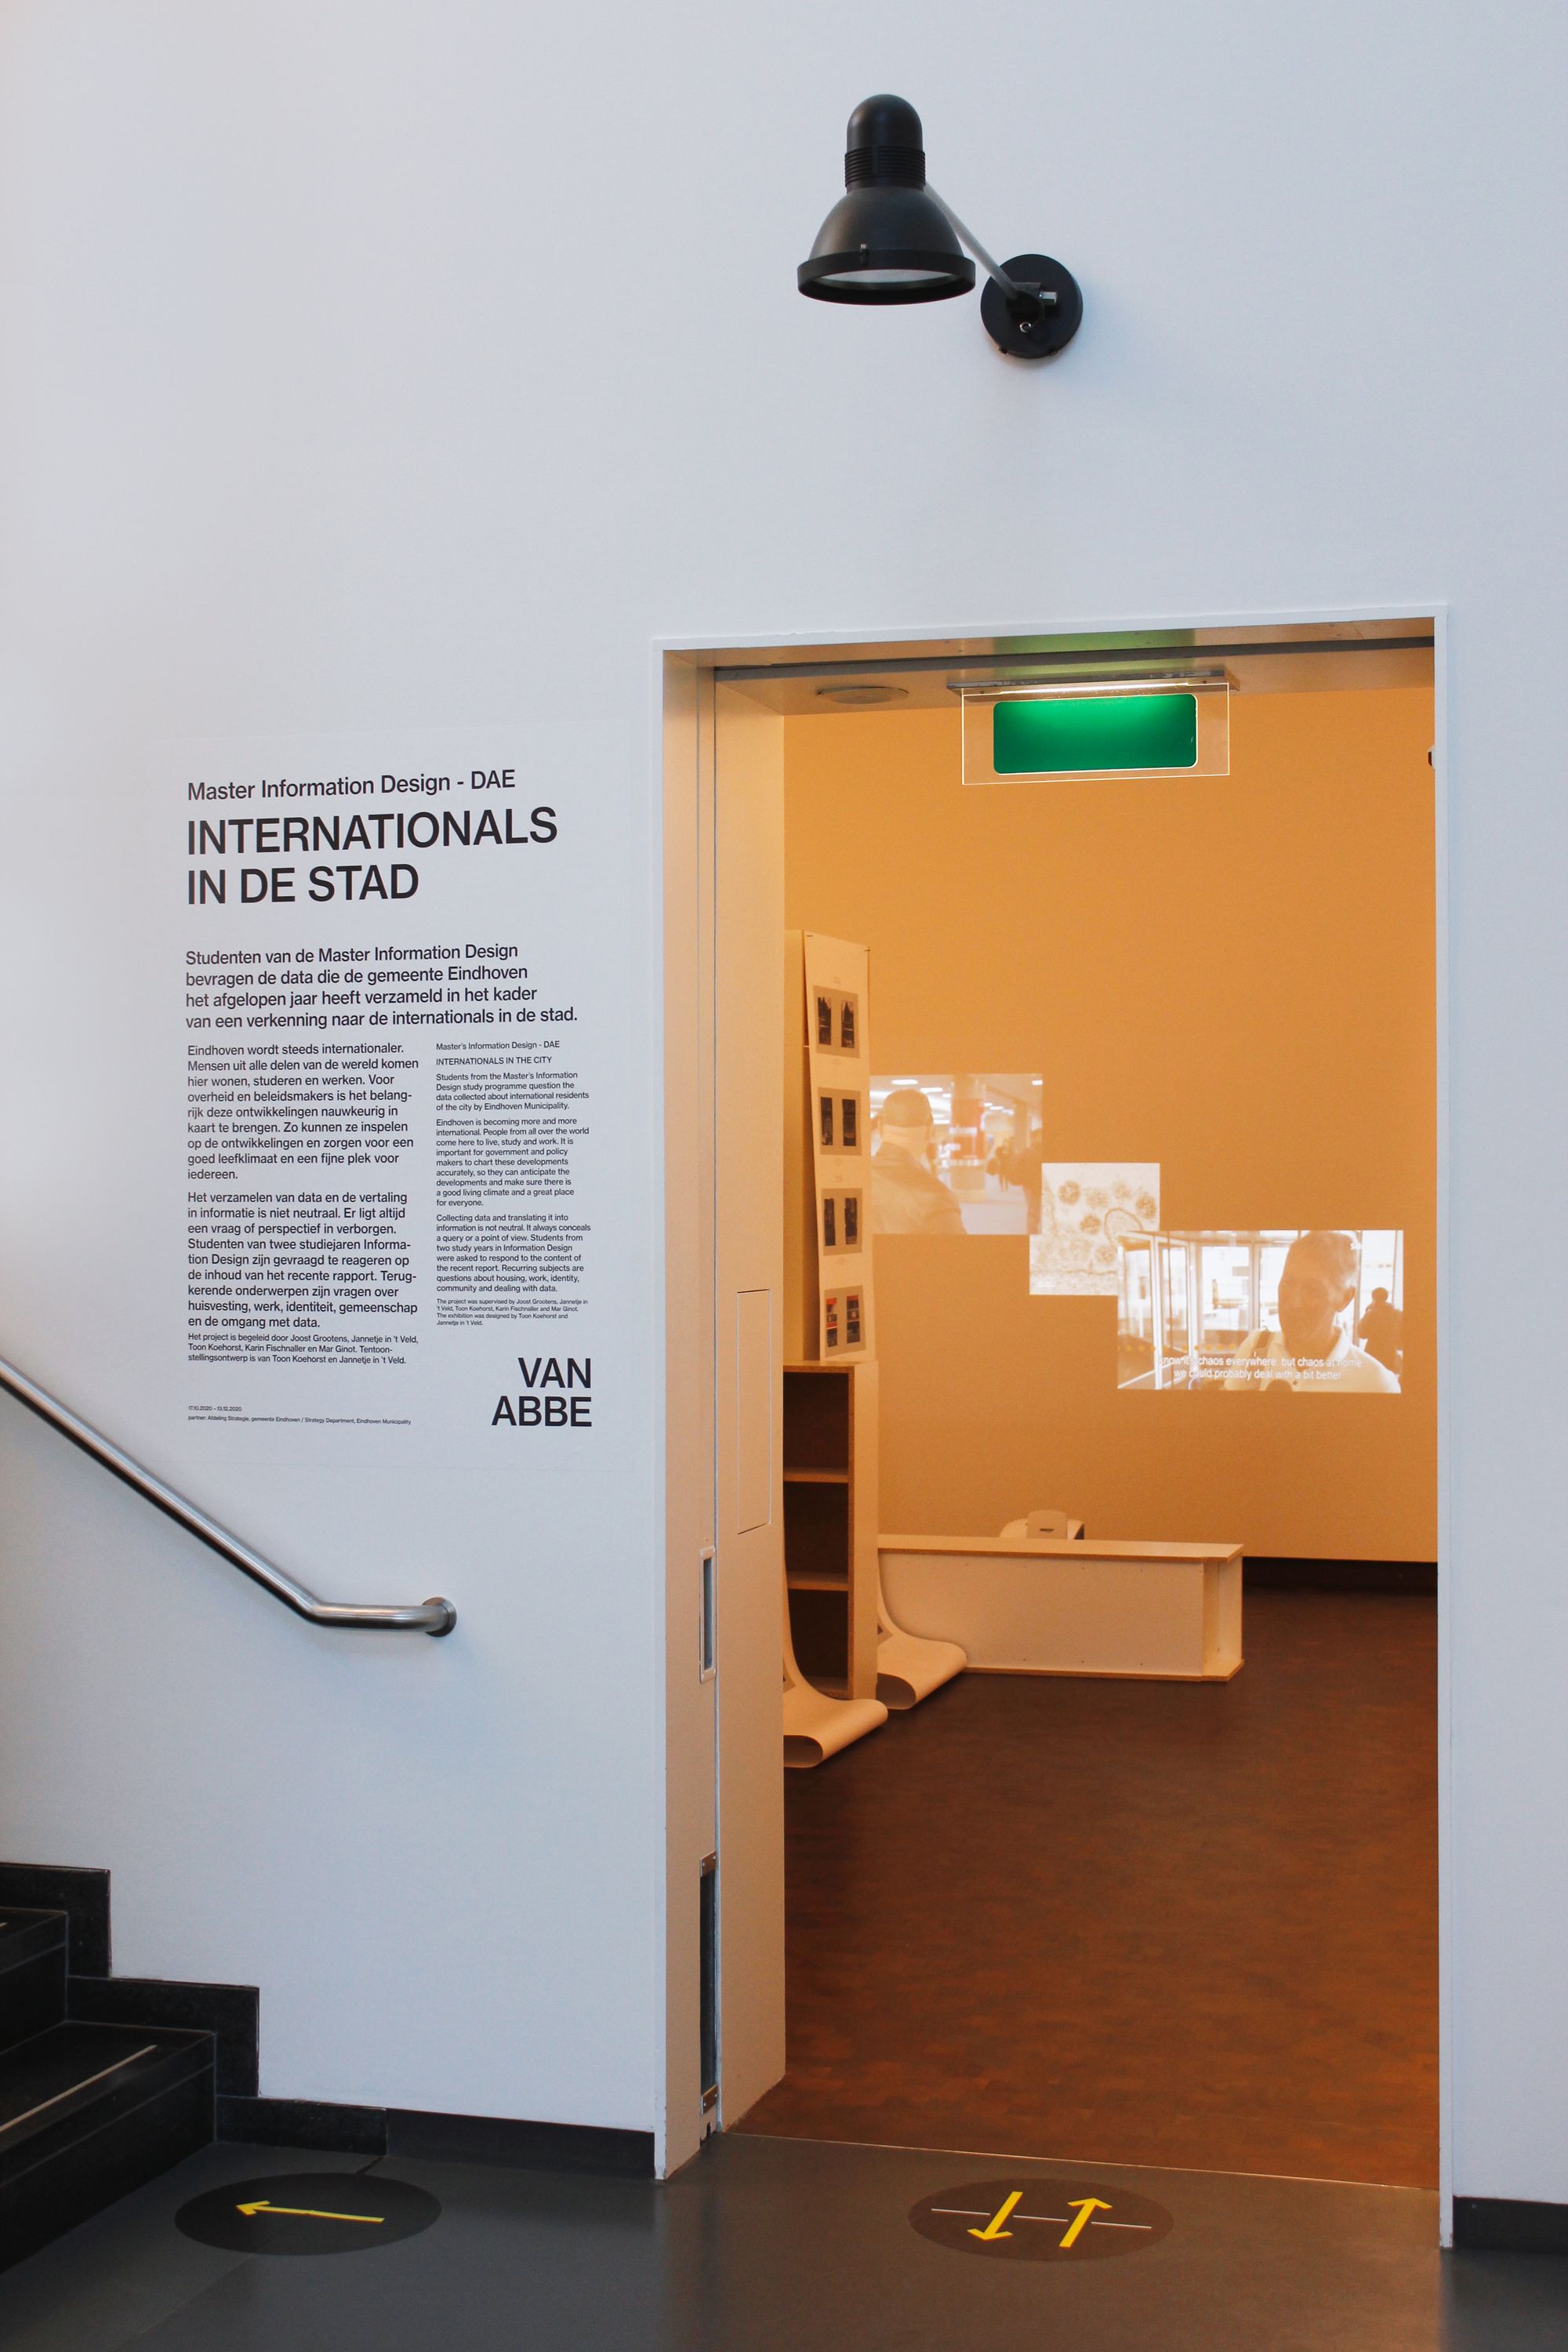 Entrance to the exhbition
The data set I was given was just a piece of a comprehensive study to document the impact of internationals in the city of Eindhoven.
 Zoom on comparison
In typical statistical fashion, the people of Eindhoven had been grouped for analysis. This aggregation and categorization in effect erased the individuality of Eindhoven’s residents for the sake of comparison. Therefore, I took a photographic approach, documenting individuals around the city, erasing them, and using the silhouetted photos as visuals for comparison.
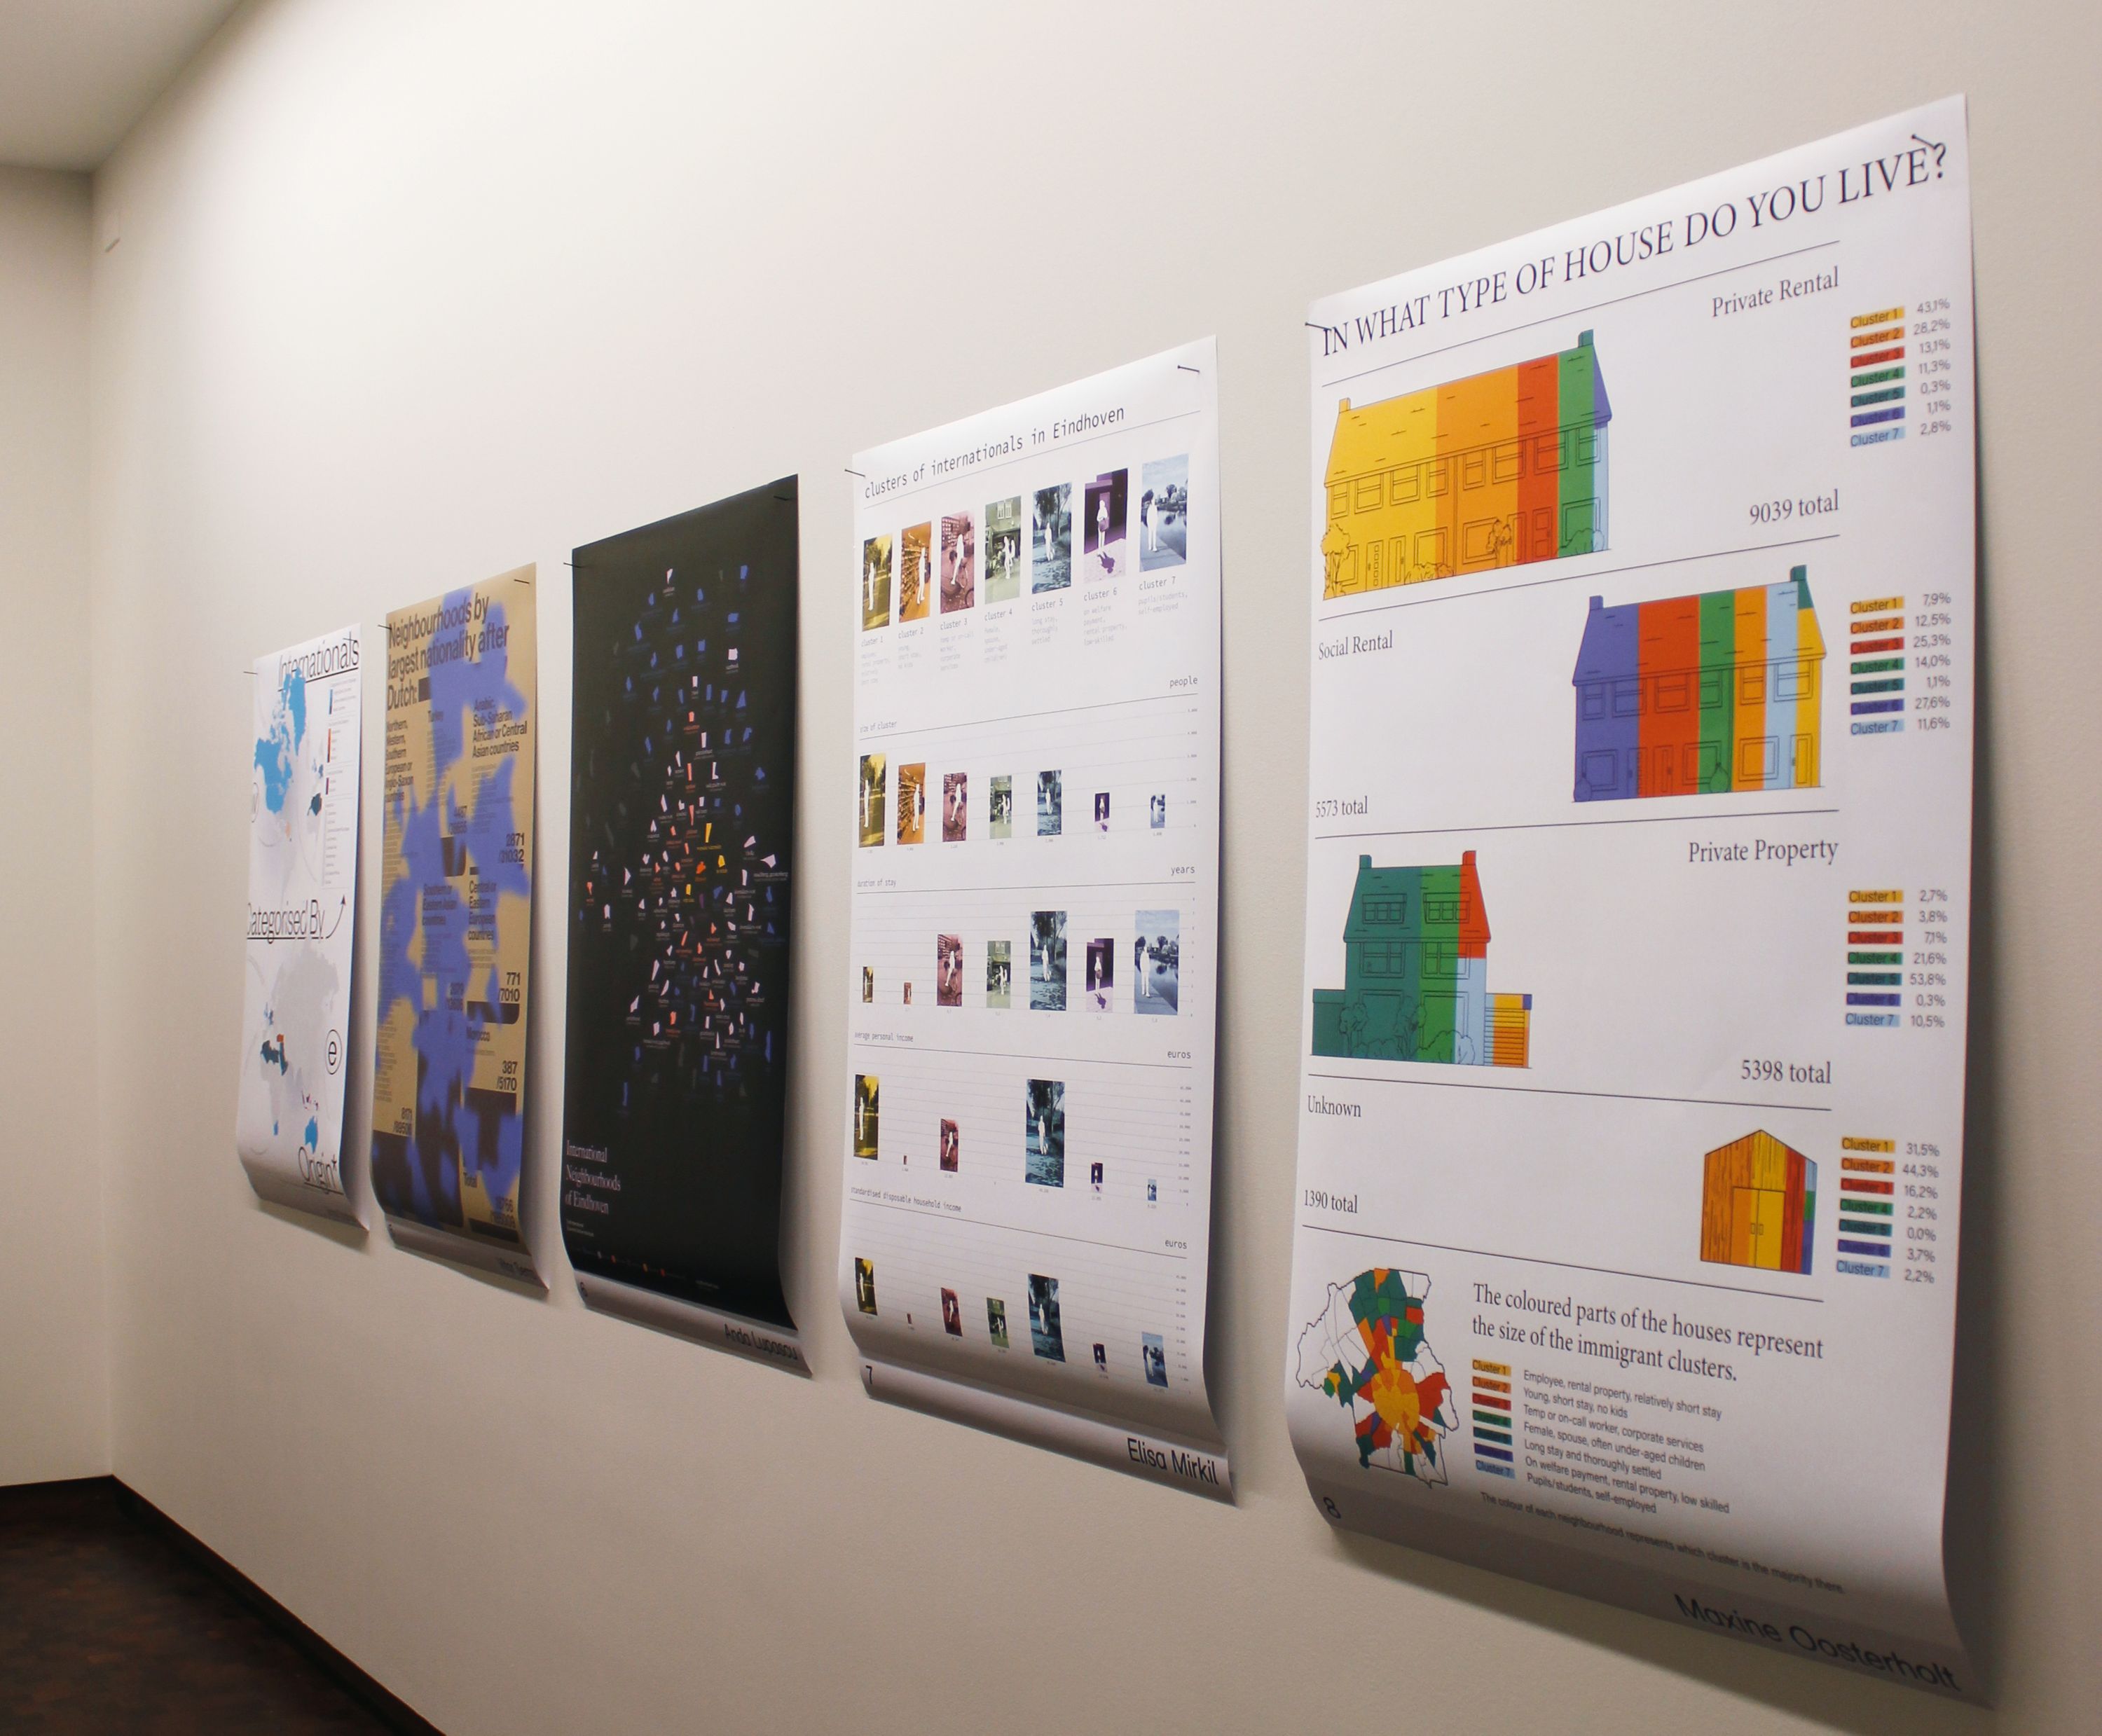 Poster hanging in the exhibition
 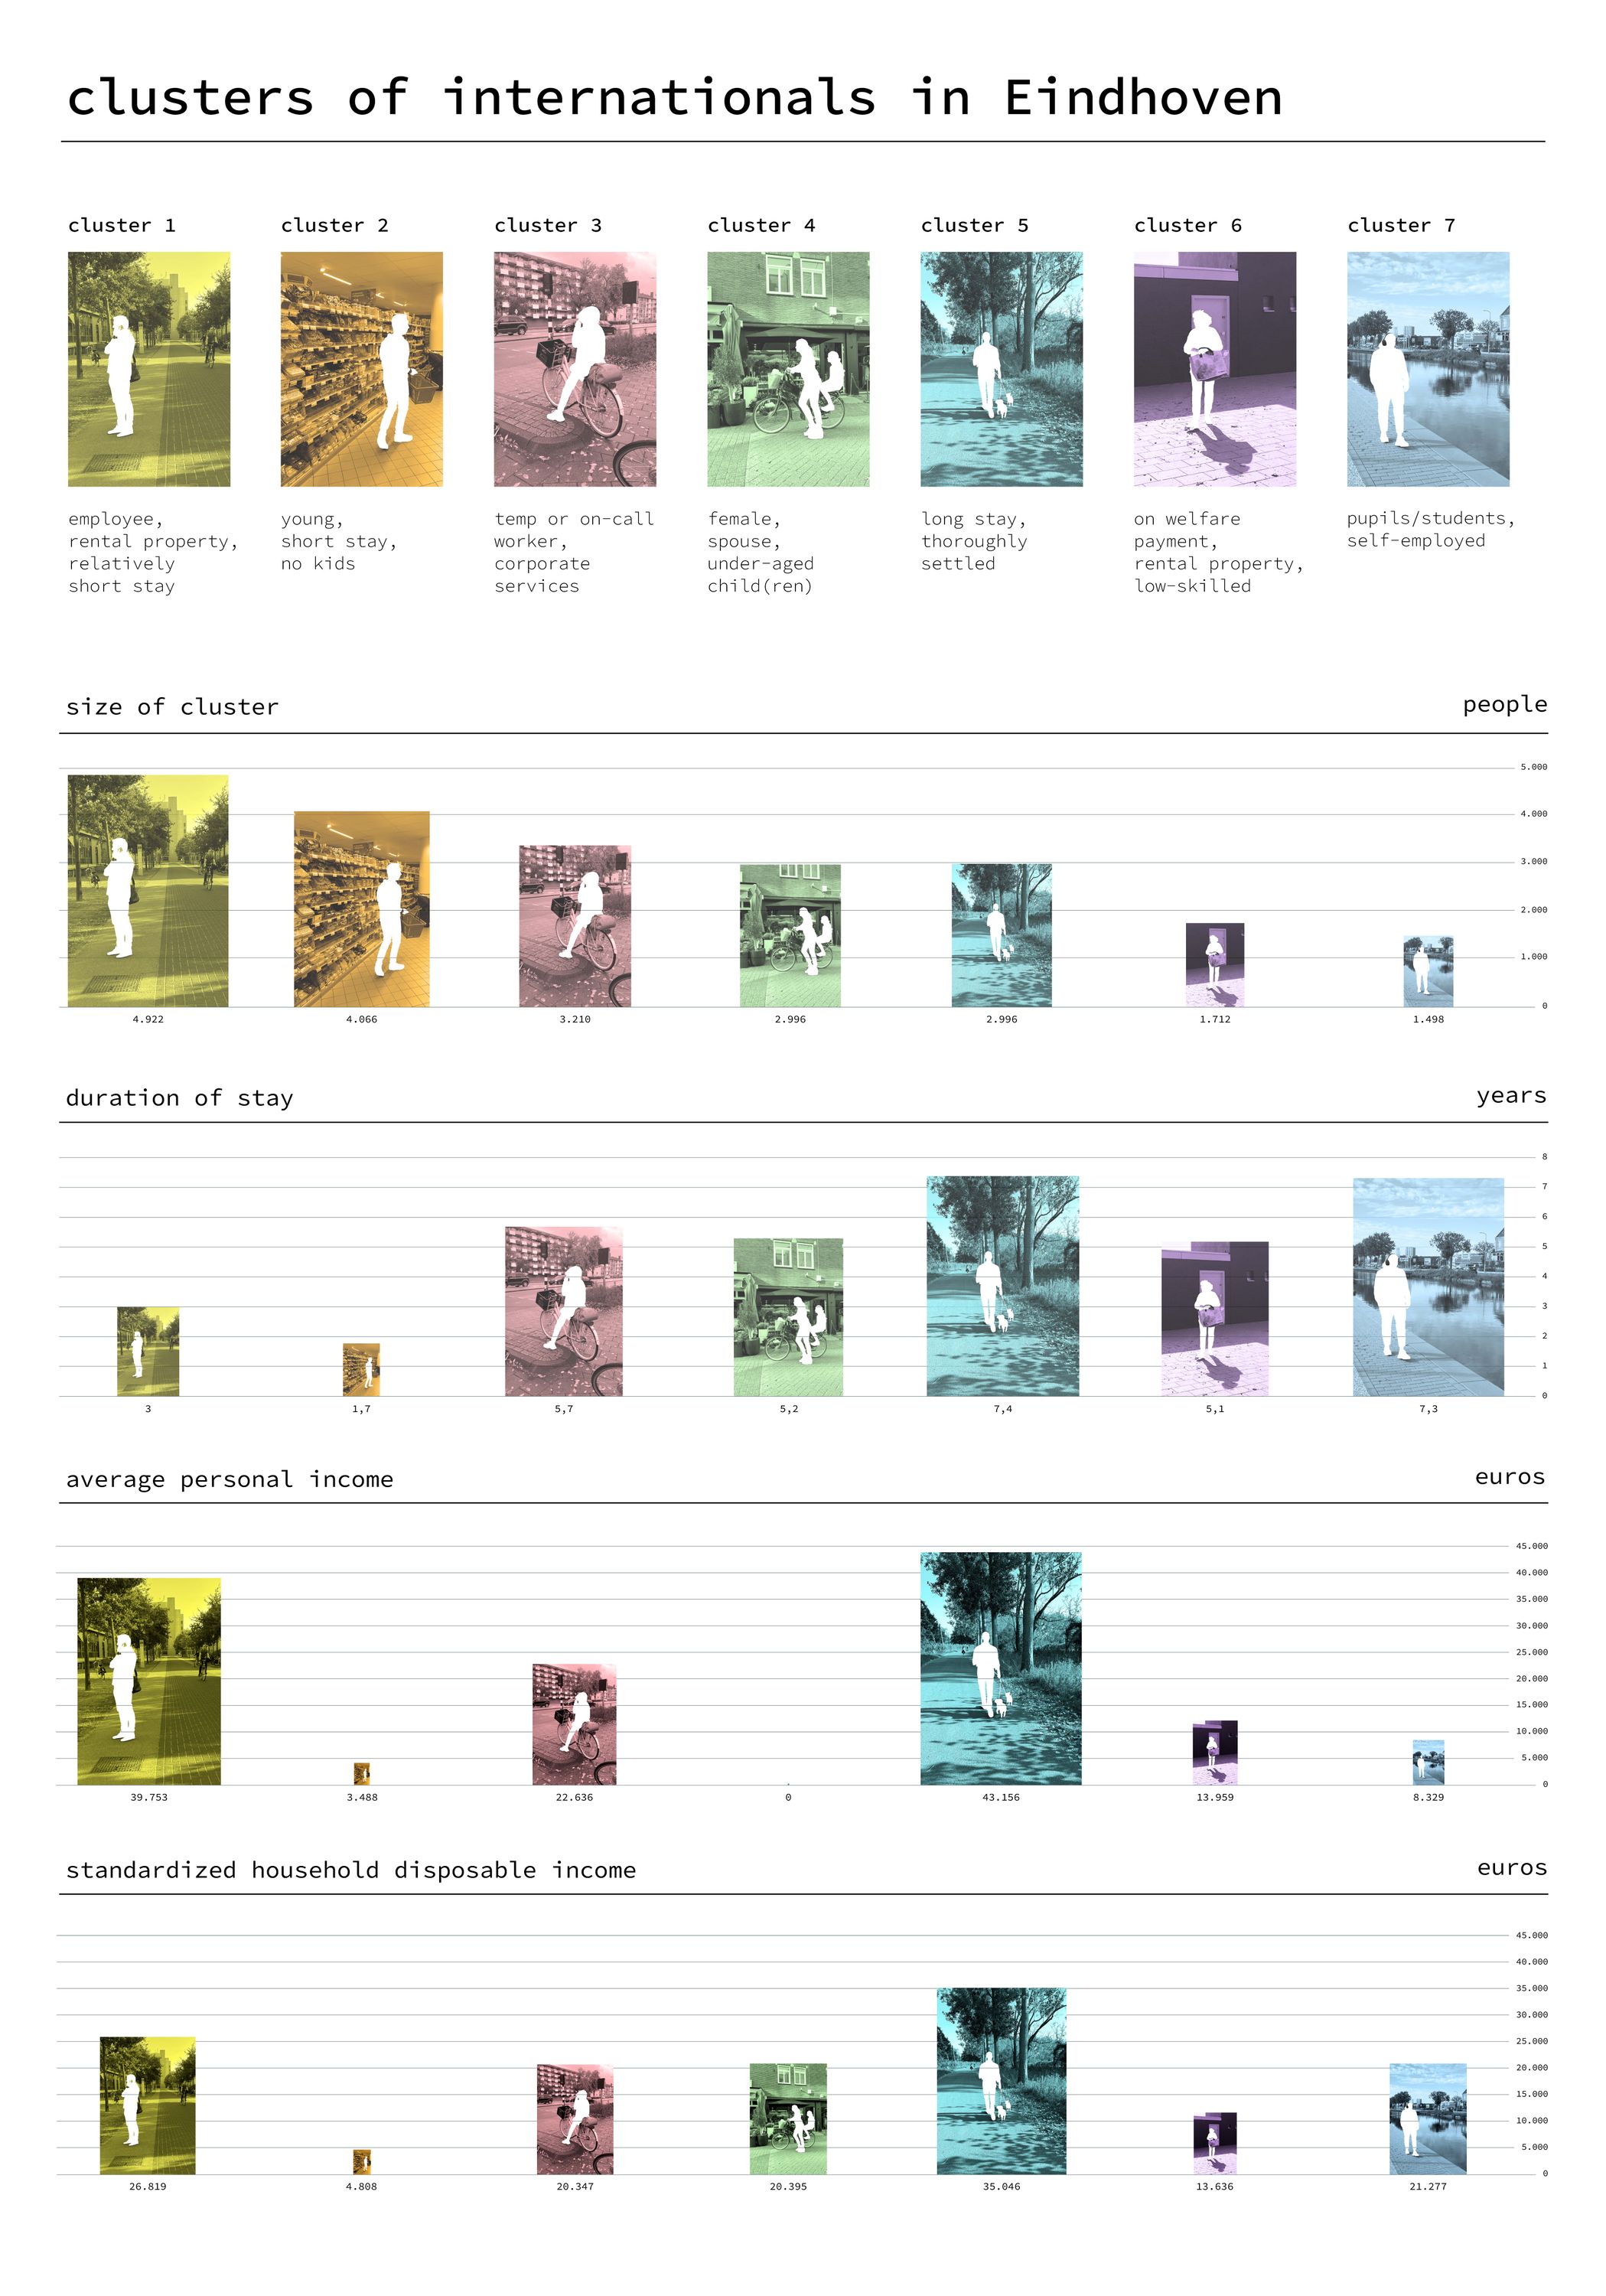 Final Poster Design